
SysLens System Monitor
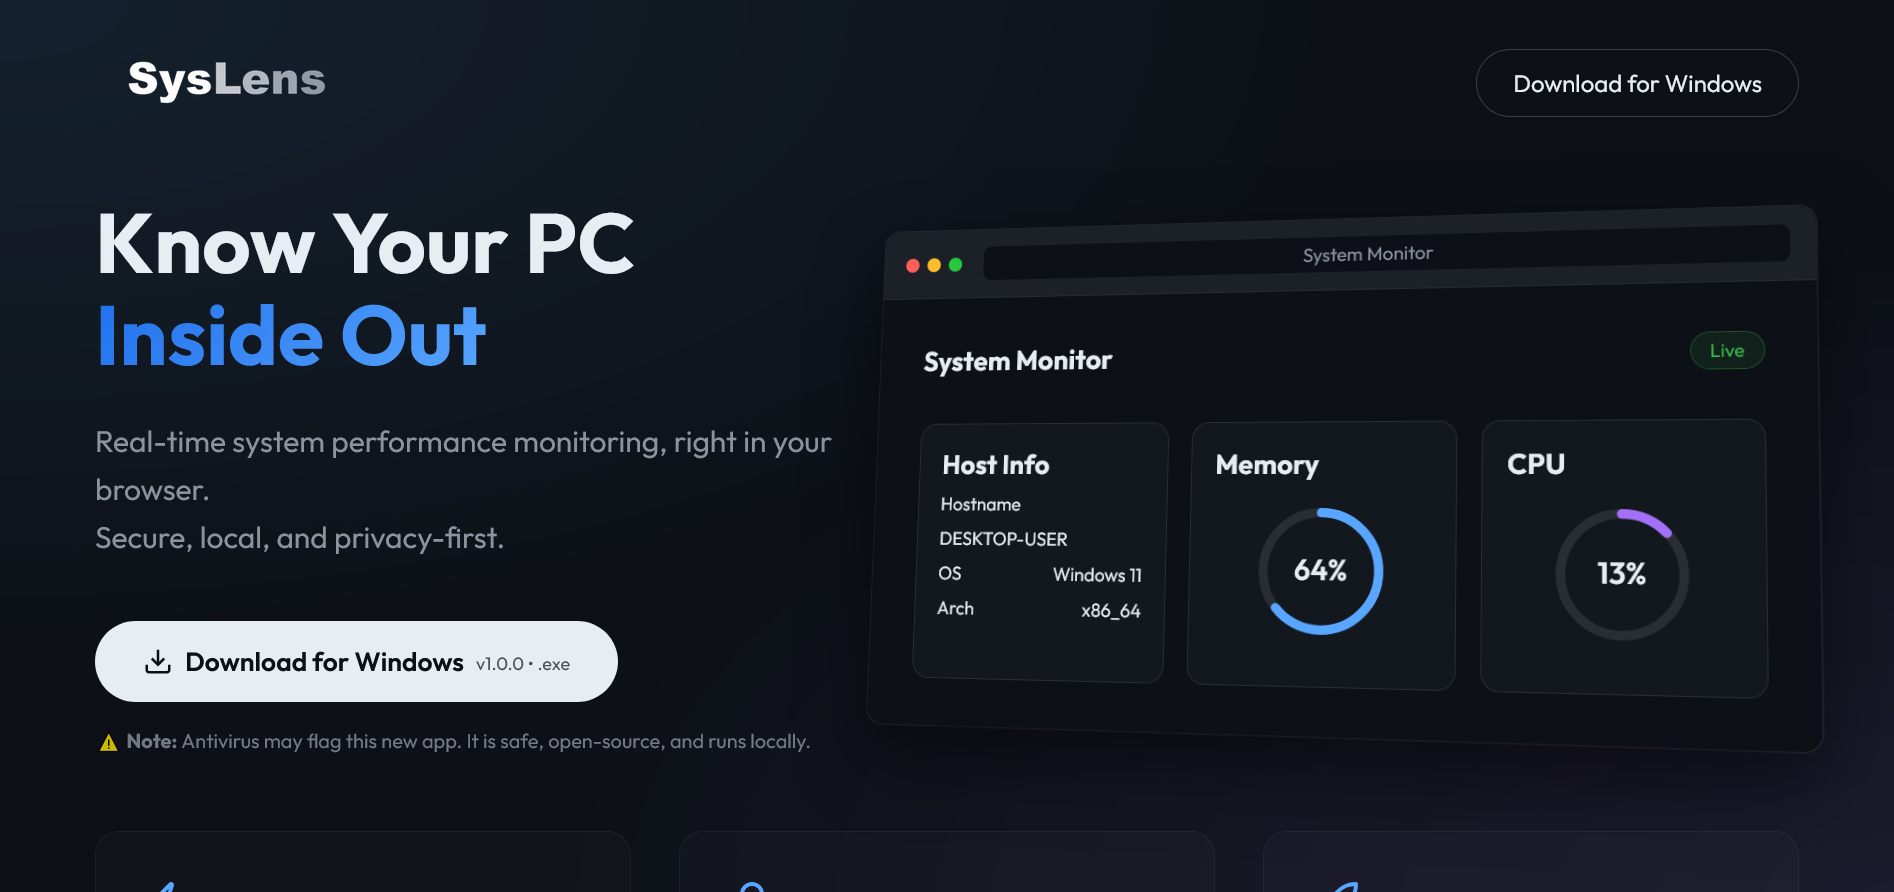
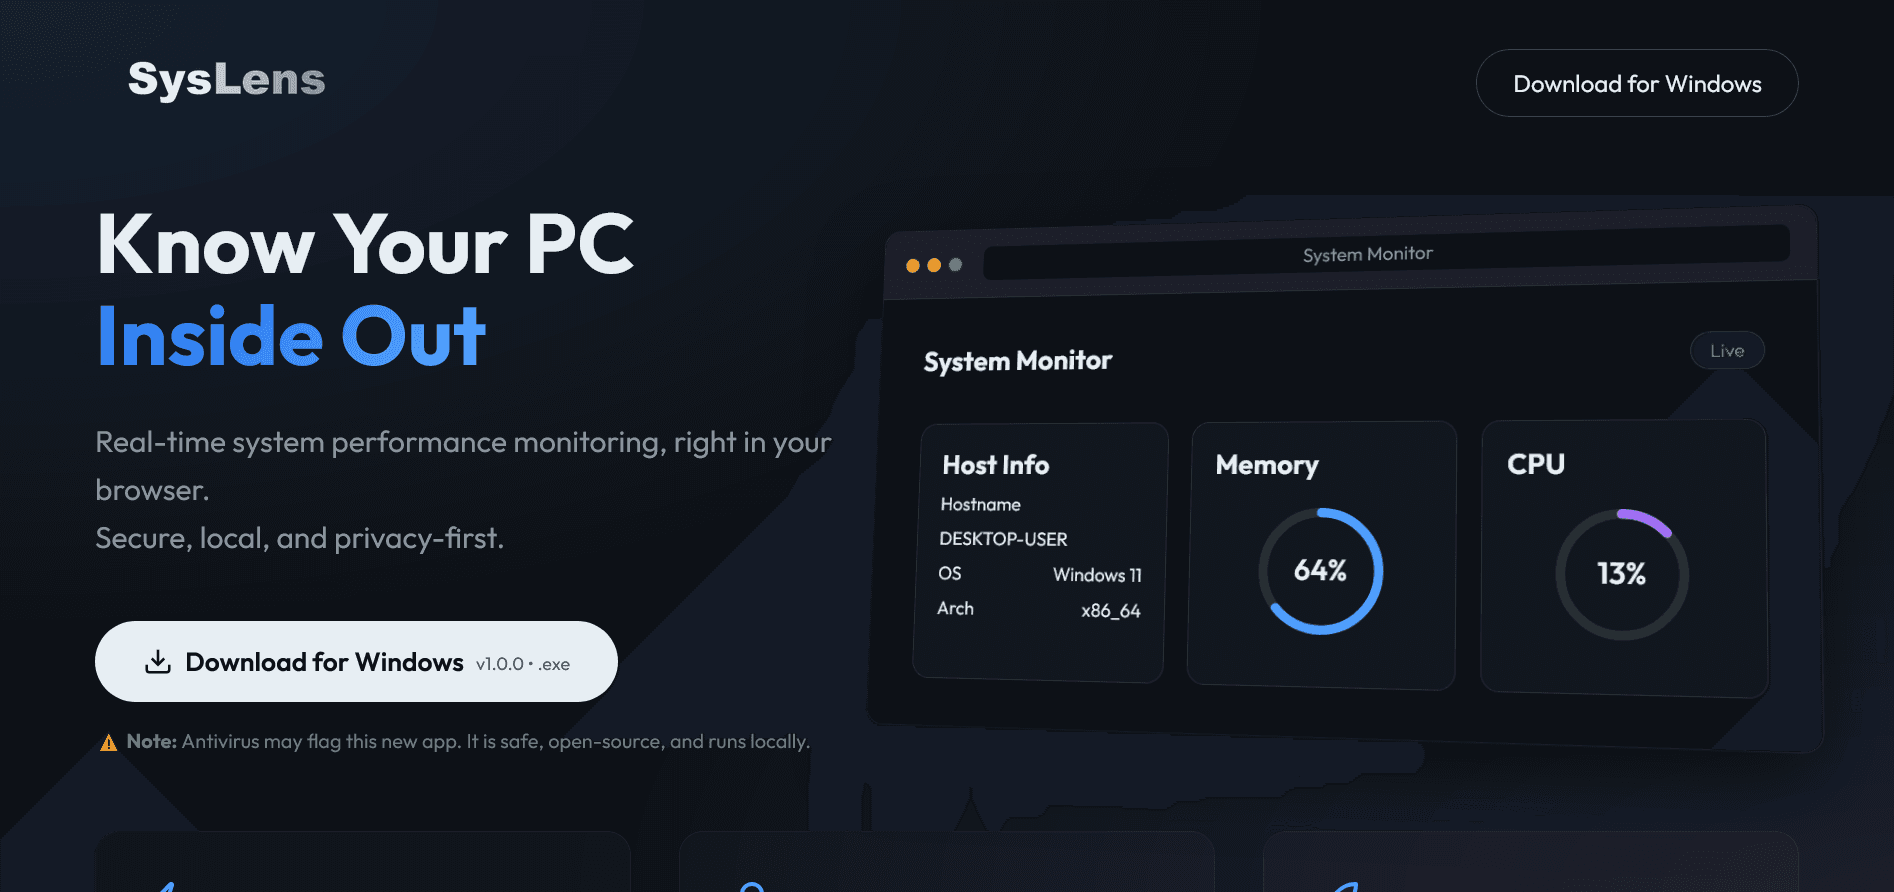
SysLens is a high-performance system monitoring utility that provides real-time insights into a computer's hardware performance through a premium web-based dashboard. Built with Go and vanilla web technologies, the application delivers critical metrics like CPU usage, memory distribution, and host information with zero external dependencies for the end-user. The project emphasizes a "privacy-first" approach by processing and displaying all data locally on the user's machine.
Project Overview
My Role
Lead Developer
Category
Desktop App
Tech Stack
Deep Dive
Case Study
A strategic look at how we tackled the technical and business objectives of this assignment.
The Challenge
Many system monitoring tools are either too basic, providing only text-based data, or too bloated, consuming significant system resources just to display stats. I wanted to build a tool that offered a professional, high-end dashboard experience while maintaining a tiny footprint. The technical hurdle was ensuring that the data collection process didn't block the web server's responsiveness, especially when calculating per-second CPU percentages. Furthermore, I needed the entire application—including all frontend assets—to be bundled into a single file for easy distribution.
The Solution
I implemented a non-blocking architecture using Go's goroutines and mutexes, where a background process constantly refreshes system metrics independently of the API requests. For the frontend, I utilized the "embed" package in Go to bake the HTML, CSS, and JS files directly into the compiled binary, eliminating the need for external asset folders. I designed a "glassmorphism" UI using pure CSS to provide a premium, modern aesthetic that feels like a native OS component. Finally, I added a platform-specific browser-launch logic that automatically opens the dashboard for the user upon execution.
The Results
The final product is a highly portable, one-click monitoring solution that launches in milliseconds and consumes minimal RAM. Developers and power users can now view their system's performance via a sleek, dark-mode interface that updates in real-time. By optimizing the build with custom linker flags and metadata, I was able to reduce the binary size significantly while ensuring it presents professional versioning information. The project demonstrates the power of combining Go's systems-level performance with modern web design principles.
Capabilities
Key Features
Real-time Performance Metrics: Live updates for CPU usage and RAM distribution every 1,000ms.
Standalone Portable Binary: A single .exe file containing both the backend server and frontend assets via Go embedding.
Premium Glassmorphism UI: A modern dark-themed dashboard featuring animated circular charts and responsive grid layouts.
Concurrency-Driven Backend: Uses background goroutines to ensure the UI remains fluid even during heavy data collection.
Auto-Launch Functionality: Automatically detects the default system browser and opens the dashboard on startup.
RESTful API Architecture: Exposes a clean JSON endpoint for system stats that could be integrated with other local tools.
Privacy-Centric Design: Operates entirely on the local network with no data ever leaving the host machine.
Optimized Build Size: Compiled with size-reduction flags and version metadata to provide a professional, lightweight release.
Project Overview The primary goal was to create a lightweight alternative to resource-heavy system monitors that often require complex installations. I developed a standalone executable that serves a local REST API and an embedded web interface, allowing users to monitor their PC's health from any browser. The application features a non-blocking backend architecture to ensure data accuracy without sacrificing system responsiveness. By leveraging Go’s concurrency model and modern CSS techniques, I focused on creating a tool that is as visually appealing as it is technically efficient.